Polling is the dark art of politics. Its power is nearly unmatched: it sways opinion, convinces people to vote or not, creates headlines and even determines policy. But there’s a reason the word “dark” appears before “art.” Polling is just as capable of lying, manipulating, and generally placing itself firmly in the “lies, damned lies and statistics” world.
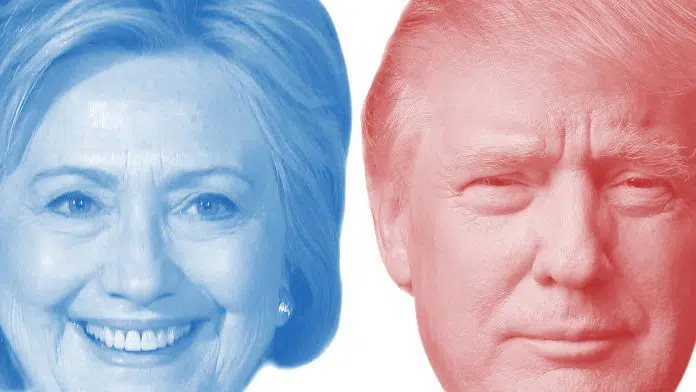
However, like it or not, it’s pretty much all we’ve got. So those of us looking at political betting markets don’t have many options. Ultimately, it comes down to viewing presidential election polls in the right context. So here’s an honest look at the poll numbers for the political battle of our time: Trump vs Clinton.
Surveying the Landscape: Polling 101
Let’s start with the fundamentals. How exactly does a presidential election poll work? First, you have to understand a fundamental truth: Polling is a snapshot. It uses models that translate a series of those snapshots into a larger picture (more on that later).
That means it’s essential to avoid the amateur mistake of looking at one poll and thinking “this changes everything” – or, as 538’s Nate Silver put it, you have to learn “when to freak out about shocking new polls”.
For more tips on how to digest polling, you can check out the venerable podcast On The Media’s “Breaking News Consumer’s Handbook” on the topic of political polling. The overall lesson between all of these is to stop, take a breath, and remember that polling is an imperfect science and it ultimately always comes down to probability.
If one candidate has a 99% chance of winning, that means that one time out of 100, the other will win. That’s just how the world works (See: Brexit).
REPRESENT… THE SAMPLE
The first and most important thing a poll has to find is its representative sample. This just happens to be one of the most difficult elements of election polls. First, you need to understand who you’re trying to poll: their gender, age, income, race – all the elements that are relevant to what you’re trying to measure.
Keep in mind that you get diminishing returns. A poll of 500 people is going to be far more useful than one of 250 people. Increase that number to 1,000, and it’s better – but not that much better. So past a certain point, sample size isn’t as critical as we think– usually around 1,000 people. With polls smaller than 400, the margin of error increases rapidly. What’s more important is, as we mentioned, how well the poll targets the demographic groups it’s trying to represent.
Then comes the fun part: How do you contact these people to create a representative sample for your poll? Phones would be nice, but how many young people do you know with a landline? What about online polling? Well, the anonymity of the internet creates a host of problems there. So what’s the answer? Generally, live interviews are considered the gold standard for their consistency.
So how should we judge polls?
GETTING JUDGMENTAL

There are a few core factors here to use when judging election polls. The most important indicator by far is past performance. That doesn’t just mean how accurate the polls were, but how consistent they were. So, let’s say a particular poll consistently favors Republicans by an average of, say, 3%. That doesn’t mean it’s not useful, it just means you should consider the number that poll gives you -3% for Republicans.
Sometimes a poll is brand new, or a firm simply changes the methodology of a specific poll. That’s why groups like the aforementioned Nate Silver’s 538 rely heavily on their own pollster ratings – ranking the different polling firms. They look at previous performance as well as evaluating their methodology to determine how heavily they should weigh individual polls. Here’s a breakdown of how they do that.
Once you’ve got a good idea of how you should evaluate individual polls, you need to come up with a structured way to look at the big picture of how they interact. Those are called models, and they’re the most important thing in model polling. You can have all the great polls and other relevant political odds, but without a solid model to plug it all into, you’re lost.
More Models Than a Beauty Pageant

No doubt Donald Trump feels right at home in this political world of competing models, all vying for attention and the ultimate prize: being right on election day. But in all seriousness, a single poll just isn’t worth very much, it’s the models that make it. That’s because a model is, in short, a poll of polls.
These days, you’ve got tons of them out there. Everyone from The Washington Post and The New York Times to 538, Real Clear Politics, and others – I should stop myself, but I could really go on. The best among them even have maps for the Senate (and a select few for the House of Representatives). But not all models are made equal.
JUDGING MODELS
So how should you judge a model? If you guessed “more or less the same way you would judge a poll,” then you’re right on the money. You can take more or less the same criterion with a few modifications. For example, a model should rely heavily on weighted polls using those pollster ratings mentioned above.
But there’s also the way a model calculates trend lines (i.e., looking at where the polls are moving and assuming they will most likely continue to move in that general direction).
THREE TYPES OF POLLING MODELS
The best example here is looking at the three different models offered by the website 538. Each shows a slightly different version of their model, demonstrating three different ways of approaching and understanding all these polls. First, you have “Polls Plus”, which looks not only at polls, but outside information like the sitting president’s approval rating, whether that president is an incumbent, how the economy is performing, etc.
The “Polls Only” model is just what its name implies. It looks only at polls, but focuses on longer-term trends, with an eye on predicting who is likely to win in November based on current polling.
Lastly, 538’s “Nowcast” is designed to discount trends and focus more on what would happen if the election were held today. Between these three examples you can pretty clearly see three different types of models you can encounter elsewhere. Sometimes all three are fairly similar, other times there can be huge differences. Bear this in mind when looking at other models!
Speaking of models, what do they have to say now?
What Do the Models Tell Us Now?
We’ve teased these models, so what do they all tell us (as of 9:00am on Monday, September 26th)? Here are the latest Hillary vs Trump political odds:
- 538 Polls Plus: Clinton with a 57.8% chance to win
- 538 Polls Only: Clinton with a 58.2% chance to win
- 538 Nowcast: Clinton with a 57% chance to win
- Washington Post‘s “The Fix”: No percentages but Clinton predicted to win.
- The New York Times‘ “The Upshot”: Clinton with a 69% chance to win
- Real Clear Politics: No percentages but Clinton predicted to barely win.
What Makes US Polling Unique
It’s not exactly a grand revelation that the US and Europe are different, but when it comes to election polls, even their views on how coffee should be consumed seem small by comparison. It’s important to note (particularly for anyone applying this information to political betting markets) that European polling is far less sophisticated than in the US.
Why is that? There are a two main reasons. First, elections are held more rarely and less consistently. So, it’s more difficult for polling firms to hone their craft. Next, European elections generally have many more candidates, making it harder to predict behavior (i.e., if someone changes their mind, which candidate would be their second choice?). So, always remember that lessons taken from US election polls can’t always be so easily applied to Europe.
What About the Political Betting Markets?
We’ve talked about all of the competing models out there. Well, remember when I said there are more than at a beauty pageant? This is what I was really talking about. In essence, every person who’s serious about calculating their own political betting odds creates their own model. In the past, these models have been highly regarded, and often very accurate, by relying on the wisdom of crowds.
However, the issue comes when you get a feedback loop – when political betting sites begin to set political odds based on what political odds political betting sites set. It’s similar to how a housing bubble works: Everyone sees prices go up so they invest more, leading to prices going up even more. That, combined with the relatively high volatility of the past few years in both Europe and the US, has led to a real crisis of confidence in polling and political betting sites.
The overall effect is that, while it’s still certainly worth looking at political betting odds, as mentioned above, take them with a grain of salt. As always, it’s best to view them in context and with other models and information taken into account.
More Political Betting Insights
Want to learn more about political betting? For more insights check out:
Or, if you want to learn more about political betting and how that influences online odds be sure to take a look at:


