
In this article we:
- Learn to calculate the odds of draws in the Premier League.
- Discuss how to predict which matches will end in a draw.
- Learn which soccer leagues have the highest draw percentages.
As any sports fan knows, soccer matches have a significantly higher chance of ending up as a draw, compared to other sports. In this article, we show how to predict which matches are more likely to end in a draw.
Approximately 24% of Premier League matches finished in a draw between the 2013/14 and 2017/18 seasons. The most probable draw score was 1-1 (42% of all draws) followed by 0 – 0 (32% of all draws) and then 2-2 (22% of all draws).
With draws accounting for almost a quarter of all matches in the Premier League over a season, it is easy to see why betting on the draw is so important in the handicap betting markets.
Of course, a draw is more likely between two sides of relatively equal strength, once the venue has been factored in.
A heavy favorite at home versus an underdog team will usually see the probability of a draw listed at around 15%, whereas two average teams will see the probabilities rise to around 29%.
Applying the Poisson Distribution to two chosen equal teams will confirm these probabilities. A Poisson Distribution approach, however, will slightly underestimate the probability of a draw in football and will require an adjustment.

How to calculate the chance of draws in the Premier League
Let’s say, for example, we have a Premier League game where oddsmakers predict an average of 2.5 total goals is expected to be scored between two equally matched teams. In this scenario, each will score an average of 1.25 goals per game against each other.
The Poisson Distribution estimates that both teams have a 29% chance of not scoring any goals. Therefore, the unadjusted probability that the game ends in a 0-0 draw is calculated by multiplying these two probabilities together.
0.29 x 0.29 = 0.08 (8% chance)
Actual historical data from the Premier League shows that a 1-1 draw, has a greater chance of occurring, at almost 13%.
Once these figures are calculated for all possible tie score outcomes, the probabilities for a 0-0, 1-1, 2-2 and so on can be added together to get the overall chance of a draw for a typical Premier League game between two evenly matched sides.
In our example and without any correction to account for the small deviation of a Poisson from reality, a draw is predicted to have occurred around 27% of the time.
Fewer predicted total goals in a match will inevitably lead to an increased chance that each team will have lower individual scores.
The probability that a side will fail to score in a less goal possible environment, where the total expected goals in an evenly contested match is just 2.2, increases from 0.29 in the previous case to over 0.33.
This, in turn, increases the possibility of the game ending 0-0 from 0.08 to 0.11 and the cumulative unadjusted draw probability rises to over 0.29.
So selecting matches that are more likely to end in draws inevitably leads us towards teams of similar quality and who may have displayed a tendency to be good defensively, but not so much offensively.
Soccer draw predictions
However, being able to identify such draw prospects is no guarantee that this heightened likelihood of a draw has not been factored into the price.
It’s also important to be aware that a team which exhibits extremes of performance, even over the course of a season, may become less extreme in the future.
A team may appear to be ‘prone’ to draws, partly by playing in low scoring games, but the persistence of this trait may be overestimated and future draws may appear to have value where none actually exists.
The Premier League teams who were involved in the most draws over a season between 2006 and 2016 were typical average teams, such as West Brom, Stoke and Aston Villa. As a group, they averaged nearly 16 draws a season compared to the league average of 10 over that period.
In the following season, however, the number of draws produced by these teams fell very close to the league average, from 16 to just over 10.
Similarly, the largely successful teams, such as Manchester City and United, Tottenham and Chelsea who appeared to avoid draws as a final game outcome had the same happen to them. From drawing an average of fewer than five games each per season in one campaign, they too regressed the following season and averaged eight draws between themselves, closer to the league average of 10 draws.
It is crucial to understand the factors which may contribute towards draws in soccer. For example, as the end to the season approaches there might be occasions where a draw is mutually beneficial to both teams. (as in Italy’s top flight league)
Which Soccer league has the most draws?
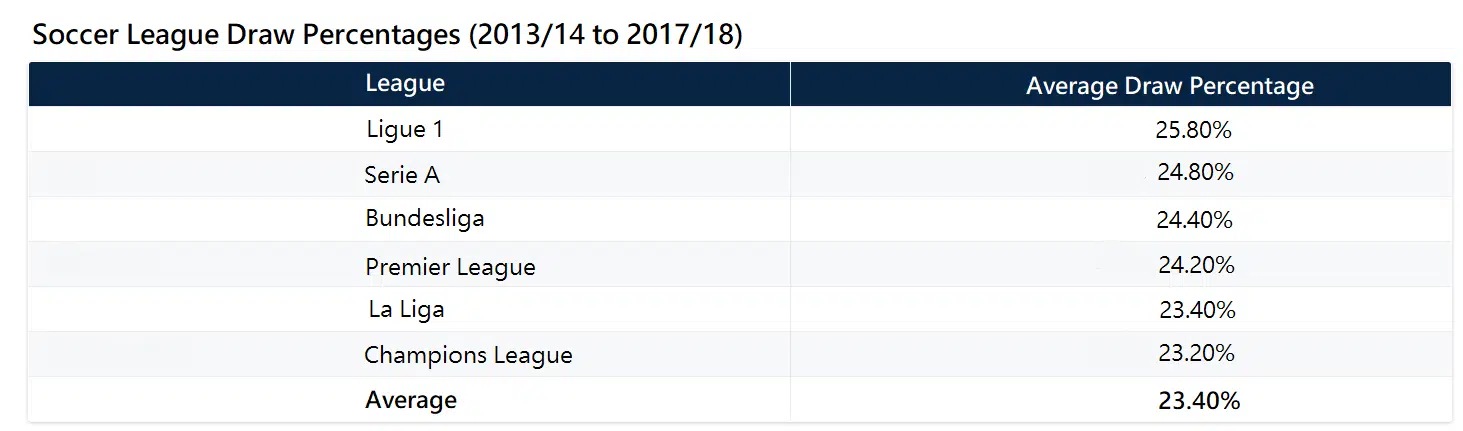
As the chart above demonstrates, the big five European soccer leagues and the Champions League have a relatively similar percentage of matches ending in draws with all of them similar to the 24.30% average across the leagues.
As a result, bettors shouldn’t place too much emphasis on the match’s league but rather focus on the individual teams in the matchup.
Related Article: What is the Most Profitable Betting Strategy?